El Niño 2026 Forecast: Record Strength Likely, What It Means
A very strong El Niño is building in the Pacific, and NOAA gives an 83% chance it becomes the strongest on record this winter. Here is the latest forecast and what it typically means around the world.
- NOAA has an El Niño Advisory in force and gives an 83% chance of a record-strength event in October to December 2026.
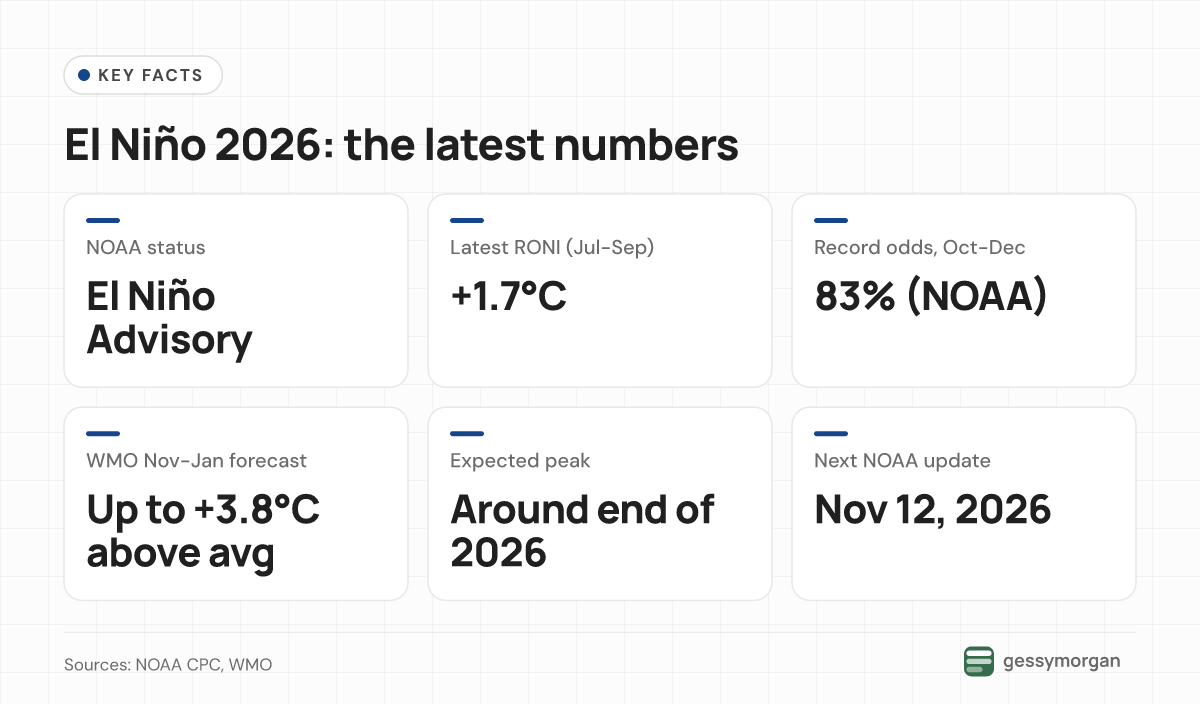
- WMO says Pacific temperatures could reach up to 3.8°C above average this winter, with a peak around the end of 2026 and effects into 2027.
- El Niño typically raises drought risk in southern Africa, Indonesia and eastern Australia and flood risk in parts of South America and East Africa.
El Niño is firmly established in the Pacific and still strengthening. As of October 26, 2026, NOAA puts the chance that this becomes the strongest El Niño since its records began in 1950 at 83% for October to December. The World Meteorological Organization (WMO) expects it to peak around the end of 2026, with effects lasting well into 2027.
That matters far beyond the Pacific. El Niño shifts rainfall and temperature patterns worldwide, raising drought risk in places such as southern Africa, Indonesia and eastern Australia, and flood risk in parts of South America and East Africa. Here is the latest outlook from the main forecasting agencies, and what El Niño typically means for weather and crops.
Where El Niño stands now
NOAA's Climate Prediction Center (CPC) has an El Niño Advisory in force. Its October 8 diagnostic discussion said "El Niño continues to strengthen", with a strong to very strong event likely through January to March 2027 (a greater than 83% chance). Parts of the eastern equatorial Pacific were more than 4°C warmer than normal at the surface, and winds and rainfall over the ocean matched a classic El Niño.
NOAA's main yardstick is the Relative Oceanic Niño Index (RONI). It subtracts warming across the whole tropics so that El Niño can be compared fairly with past events. The latest three-month value, for July to September 2026, is +1.7°C, according to NOAA's October 19 update. The El Niño threshold is +0.5°C, and NOAA counts an event above +2.5°C as record-breaking.
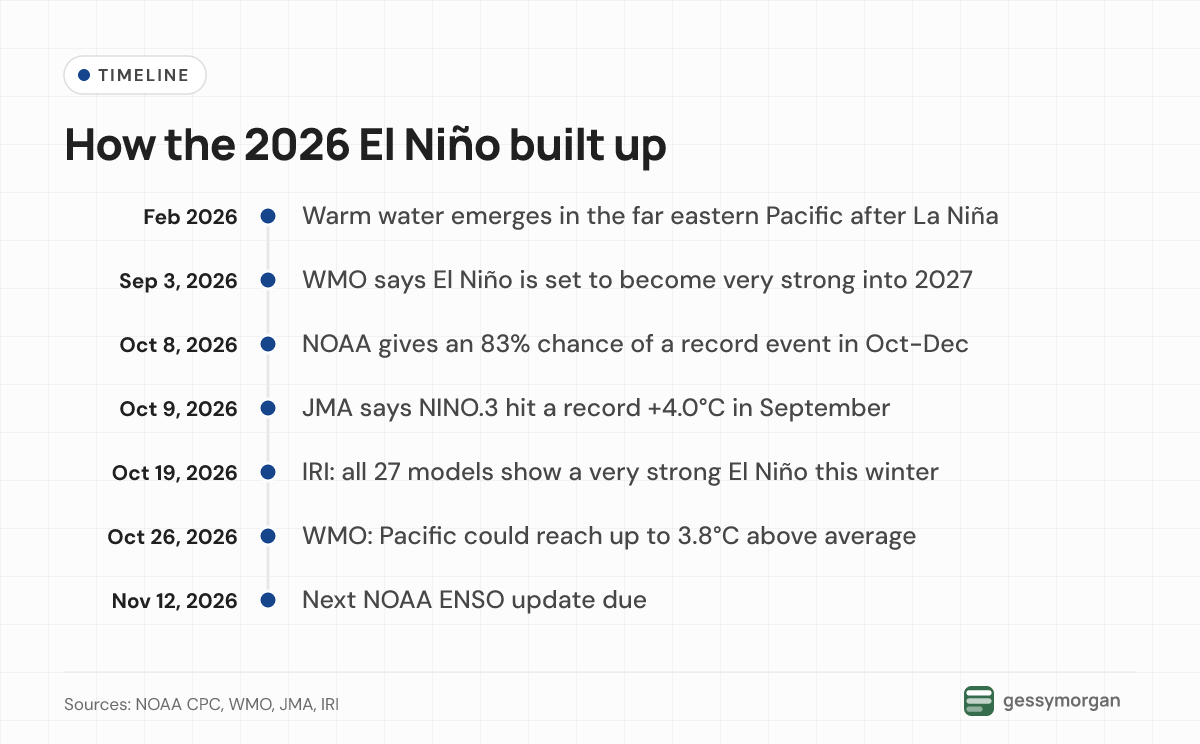
Other measures already show records. The Copernicus Climate Change Service reported that the Niño 3.4 region's monthly temperature anomaly hit 2.99°C in September, beating the 2.81°C set in December 1997. The Japan Meteorological Agency (JMA) said its NINO.3 index reached +4.0°C in September, the highest since its records began in 1949.
Why do the numbers differ? Agencies use different ocean regions, datasets and baselines, and NOAA's RONI is lower because it removes background warming of the tropical oceans. All of them point the same way: a very strong event, still growing.
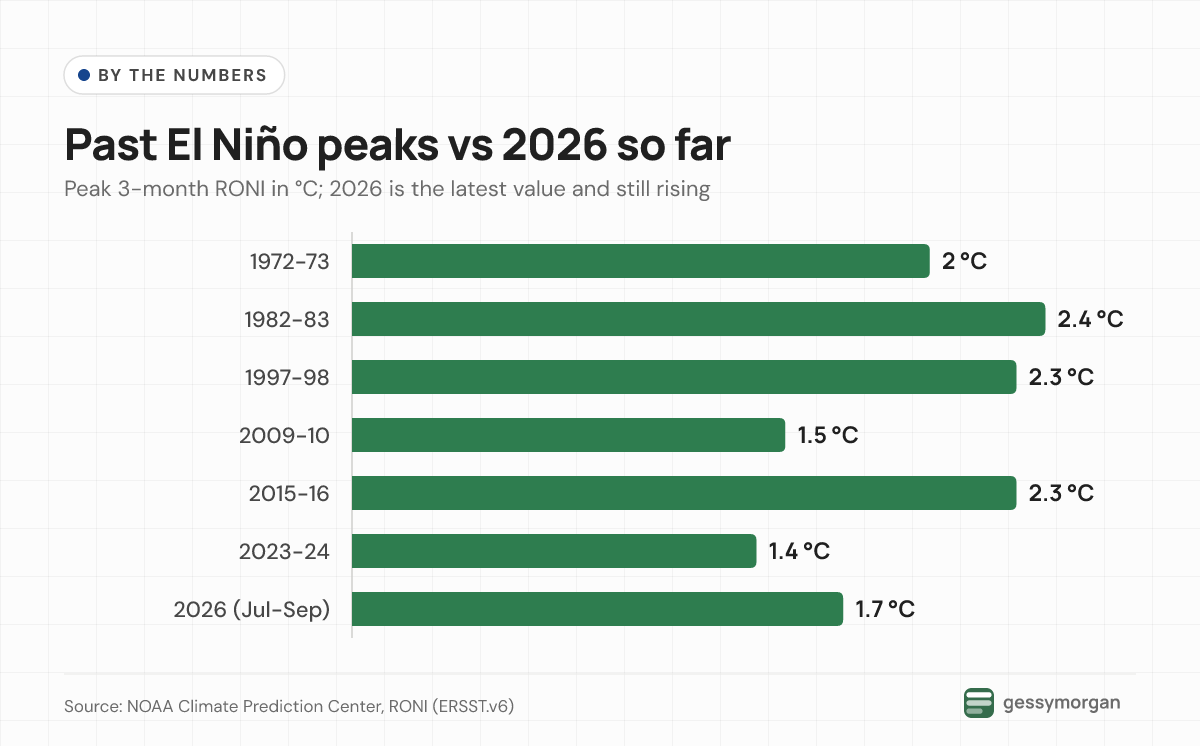
The forecast: how strong, and for how long?
NOAA (United States)
NOAA's official outlook gives the chance of a record event (a three-month RONI of +2.5°C or more) as 54% for September to November, 83% for October to December and 70% for November to January. El Niño is expected to last through March to May 2027, with neutral conditions favoured from April to June 2027. The next update is due on November 12, 2026.
IRI (Columbia University)
The IRI forecast issued on October 19 shows all 27 models it tracks predicting a "very strong" event (Niño 3.4 at +2.0°C or more) from October to December through December to February. The average of the models reaches about +3.5°C, and IRI says the event "could rank among the strongest events in the historical ENSO record." Neutral conditions only become the most likely outcome by June to August 2027.
WMO
The WMO's Global Seasonal Climate Outlook, presented on October 26, says tropical Pacific temperatures could reach up to 3.8°C above average from November 2026 to January 2027. Secretary-General Celeste Saulo said: "This is literally off the monitoring charts that we have used for the past four decades." In early October the WMO put the chance of El Niño lasting through February 2027 at near 100%.
JMA (Japan) and Australia
JMA's October 9 outlook says the record-strength event is "virtually certain (100%) to continue until boreal winter" and is likely to peak during that season. Its next update is due on November 10.
Australia's Bureau of Meteorology publishes its own climate driver updates on El Niño and the Indian Ocean Dipole, and is the official source for Australian outlooks. Both WMO and JMA report a positive Indian Ocean Dipole this season. The WMO says this, along with a warm tropical Atlantic, could strengthen, weaken or change El Niño's usual effects.
How this El Niño developed
The Pacific spent early 2026 in cool, La Niña-like conditions. NOAA's update shows above-average temperatures emerging in the far eastern Pacific from early February 2026, then spreading across the east-central Pacific from mid-April. The RONI rose from -0.9°C in December to February to +1.7°C by July to September.
By September the WMO said El Niño was set to become very strong. UN Secretary-General António Guterres warned: "El Niño is being supersized before our eyes."
What El Niño typically means around the world
El Niño shifts the odds rather than guaranteeing outcomes. "El Niño impacts vary from one region to another and often even within the same region, and also from season to season," said Wilfran Moufouma Okia, who heads WMO's climate prediction section. The typical pattern, based on the WMO's overview and its current outlooks, looks like this:
Rainfall and drought
- Australia: higher drought risk in eastern and northern Australia.
- Southeast Asia and Indonesia: below-normal rain and more heat, with wildfire and haze risks that the WMO says are already rising.
- Southern Africa: drier conditions more likely from November, when the rainy season normally starts, threatening harvests and water supplies.
- East Africa: a wetter October to December "short rains" season in parts of the region, raising flood risk.
- South Asia: a weaker monsoon. The WMO says regional forecasters correctly predicted a weak June to September 2026 monsoon, with India seeing shortfalls.
- Americas: more rain and flooding in parts of South America and the southern US, and rising drought risk in Central America, the southern Caribbean and the Amazon.
Winter temperatures in the US and Europe
For the US, El Niño winters roughly reverse La Niña's pattern, NOAA explains. That usually means cooler, wetter conditions across the southern tier from California to the Carolinas, and warmer, drier weather in the Pacific Northwest and Alaska, strongest from December to February.
Europe's signal is weaker. The UK Met Office notes that very strong events, such as 1982/83 and 1997/98, can flip El Niño's usual cold signal in the Baltic region of northern Europe to a warm one.
Global heat
El Niño usually warms the planet, with the biggest effect in the year after it develops; the WMO says the 2023-24 event helped make 2024 the hottest year on record. Copernicus reported that September 2026 was the second-warmest September on record, 1.63°C above pre-industrial levels. It expects months above 1.5°C to continue into 2027. As Saulo put it, "El Niño doesn't add new heat to the planet," but it draws on the warmest oceans ever measured.
Crops, food and fisheries
The WMO's World Food Day briefing lists the farm risks: dry soils and stressed pasture in parts of the northern Horn of Africa after a poor June to September season, a weak South Asian monsoon that matters for rice, and drought worries in Southeast Asia. "Even warmer winters can have important agricultural consequences," said WMO scientist Sebastian Grey, because heat raises water demand and can cut wheat yields. At sea, Peru halted anchoveta fishing.
The Pacific has also seen many tropical cyclones this season, the WMO notes; see our coverage of Super Typhoon Champi. Humanitarian agencies are already planning ahead. Saulo said: "A powerful El Niño does not have to be a recipe for humanitarian disaster," urging early action to protect vulnerable communities.
Our take
The agencies agree on direction and timing: a very strong El Niño peaking around December or January, then fading through spring 2027. They differ on the exact numbers, mostly because they use different indices. For most readers, the headline number matters less than local outlooks. A strong El Niño raises the odds of drought or flooding in certain places and seasons, but it does not decide any single storm or harvest.
National weather services are the best guide to local effects, and the coming three months are when the biggest impacts usually arrive.
What to watch next
- JMA's next outlook on November 10 and NOAA's on November 12, 2026.
- Whether NOAA's RONI passes +2.5°C, its threshold for a record event.
- The start of southern Africa's rainy season in November and East Africa's short rains.
- Global temperature reports, since El Niño's warming effect tends to peak the following year.
Frequently asked questions
Is there an El Niño in 2026?
Yes. NOAA's Climate Prediction Center has an El Niño Advisory in force, and the WMO, JMA and IRI all describe a strong and strengthening event. As of October 26, 2026, it is expected to peak around the end of the year.
How strong will El Niño be in 2026-27?
Very strong, and possibly the strongest on record. NOAA gives an 83% chance its RONI index reaches +2.5°C or more in October to December, and all 27 models tracked by IRI forecast a very strong event this winter.
When will El Niño end?
NOAA expects El Niño to last through March to May 2027, with neutral conditions favoured from April to June 2027. IRI says neutral becomes most likely by June to August 2027.
What does El Niño mean for Australia?
Historically, El Niño raises the risk of drought in eastern and northern Australia, according to the WMO. Local outlooks depend on other drivers such as the Indian Ocean Dipole, so Australians should check the Bureau of Meteorology's climate driver updates.
Does El Niño make the world hotter?
El Niño usually warms global temperatures, with the biggest effect in the year after it develops. Copernicus reported that September 2026 was 1.63°C above pre-industrial levels and expects months above 1.5°C to continue into 2027.
Sources
- ENSO Diagnostic Discussion (October 8, 2026), NOAA Climate Prediction Center
- ENSO: Recent Evolution, Current Status and Predictions (October 19, 2026), NOAA Climate Prediction Center
- Relative Oceanic Niño Index (RONI), NOAA Climate Prediction Center
- IRI ENSO Forecast (October 2026), International Research Institute for Climate and Society, Columbia University
- El Niño set to become very strong, raising risks of extreme weather into 2027, World Meteorological Organization
- Sea-surface temperatures reflect strengthening El Niño, World Meteorological Organization
- El Niño looms large on World Food Day, World Meteorological Organization
- El Niño puts humanitarian weather services in the spotlight, World Meteorological Organization
- WMO Global Seasonal Climate Outlook informs humanitarian action, World Meteorological Organization
- El Niño / La Niña, World Meteorological Organization
- El Niño Outlook (October 2026 - April 2027), Japan Meteorological Agency
- Surface air temperature for September 2026, Copernicus Climate Change Service
- How El Niño and La Niña affect the winter jet stream and U.S. climate, NOAA Climate.gov
- El Niño, La Niña and the Southern Oscillation, Met Office
How we wrote this
GessyMorgan explainers are built from public reporting and official sources. This post draws on the 14 sources listed above, each linked where we use it. It was drafted with AI assistance and checked against those sources before publishing. We did not test products, attend events or interview anyone for this article. Facts are current as of October 26, 2026, and we update the post when they change.